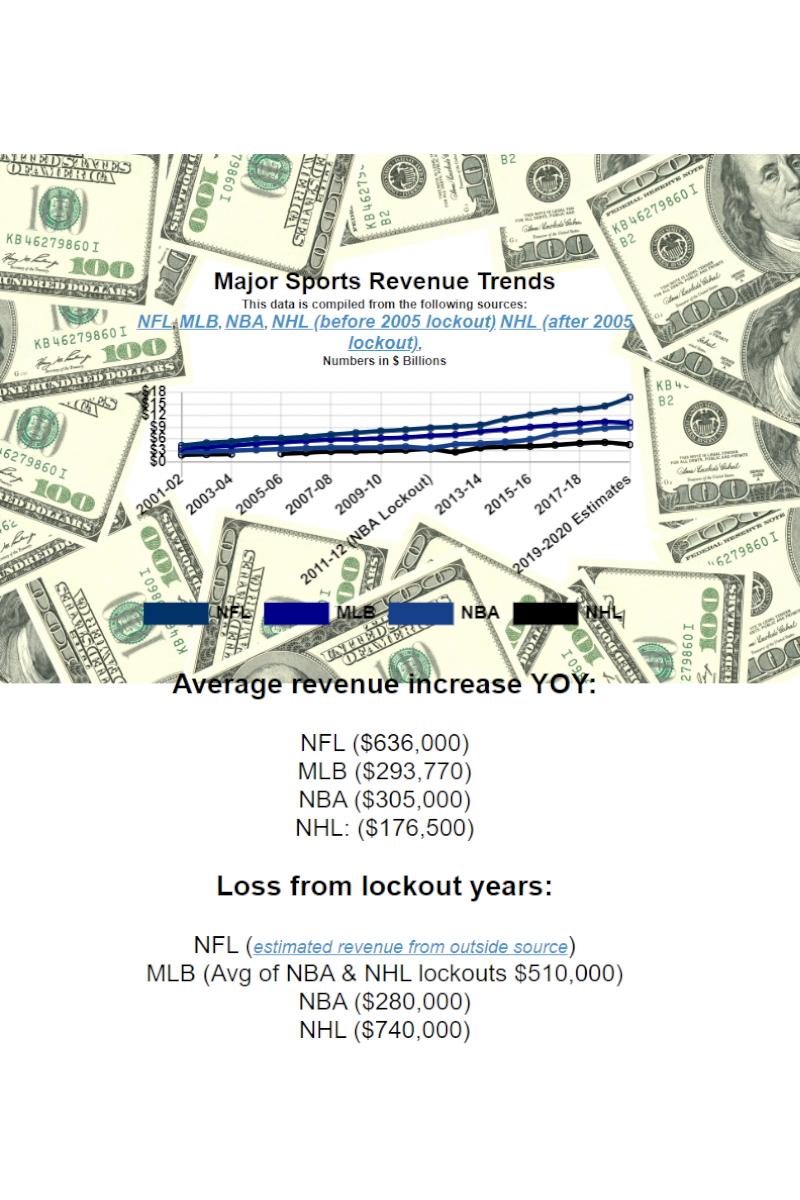
This project was a redux of our T GIS 504 Final with a twist. We were required to come up with our own data for two charts. This chart is a comparison chart showing the revenue of the four major professional sports leagues in the United States. It also displays an estimate of potential revenue for this year based on previous seasons when leagues held no games due to lockout. The other chart can be found here.
Estimates were determined by first gathering the YOY revenue average. Then deteremining expected loss in revenue based on previous lockouts during the 2011-2013 seasons. Then subtracting this loss from last seasons revenue totals. In MLB's case, they have not had a lockout to show for, so the average of the NBA and NHL partial season lockouts were used. The 2004-05 NHL season was not taken into consideration due to having no record of revenue dollar, likely due to a complete season closure. Equation used: (YOY Avg Rev - (Revenue 1 Season prior to LO - LO Season Revenue) + 2018-19 Revenue) However, this concept does not take inflation into consideration.
-
9 June 2020
-
Professor:
Dr. Emma Slaeger
-
Posted by:
Isaac Van Mechelen