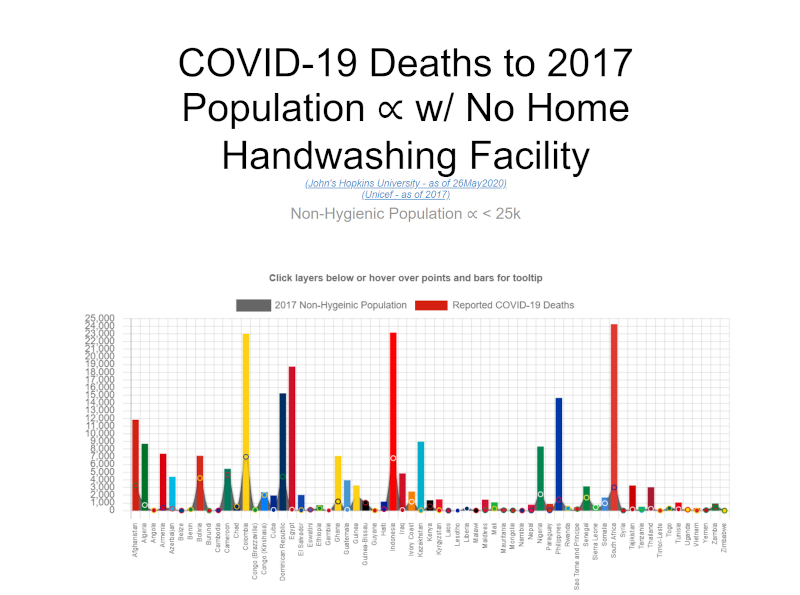
This project was a redux of our T GIS 504 Final with a twist. We were required to come up with our own data for two charts. This chart is a proportion charting vulnerable populations in areas of the world with no home hand washing facilities. The other chart can be found here.
Chart.js is one of many different options that exist for making charts and graphs with JavaScript. Other common libraries include D3.js and Chartist.js. While each has its own advantages, Chart.js was chosen for this lab because it is relatively easy to use, has good documentation, and is an overall great option for simple charts and graphs.
-
9 June 2020
-
Professor:
Dr. Emma Slaeger
-
Posted by:
Isaac Van Mechelen