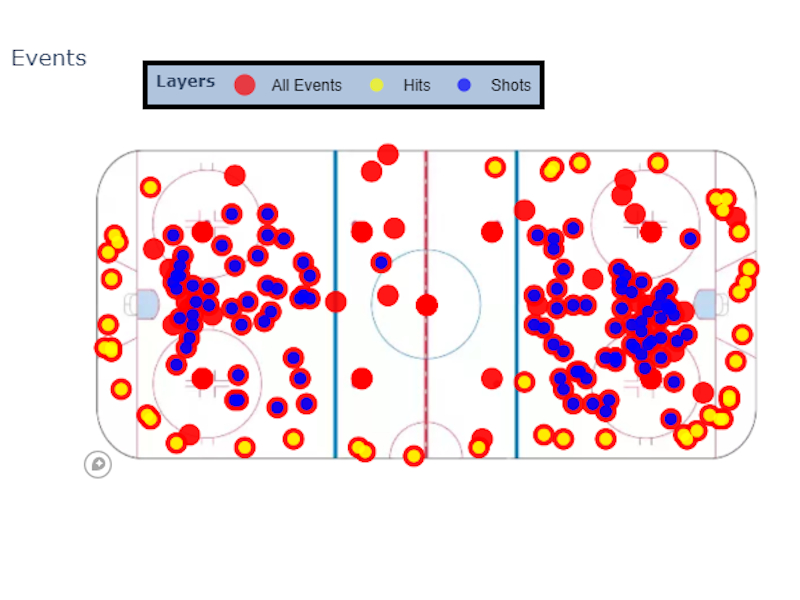
In the subsequent lab to our final, we began working directly with REST APIs and virtual machines, intergrating our work flow into the computational power available through cloud services. We built our environment using Python 2.7+ and installed Jupyter Notebook, Folium, and Geopandas, using -c conda-forge or pip. Instead of using azure services, as in the subsequent lab we were offered the freedom to flex into other API services. I chose the NHL API so I could begin dipping my toe in the proverbial waters of my capstone project. Additionally, I chose to lean on specific Python libraries; Geopy, Numpy, Plotly, and most importantly Pandas. We were previously required to gather sentiment analysis, instead I began gather specific event types from a single game.
The project required an understanding of how to flatten json data, how to manipulate Pandas dataframes, and how to embed the use of a mapbox token key from an external file sources, among other things. In my completion of the project, I was able to display an output for filtering Hits and Shots among All Events. Using this project template I have built subsequent data visualization models on top of a very foundational icerink tileset hosted through Mapbox GL.
-
17 March 2020
-
Professor:
Dr. Jim Thatcher
-
Posted by:
Isaac Van Mechelen