Steps:
• Added file as layer(s)
• Changed coordinate system
• Using attribute table, created layers from list of NHL Cities
• Joined to layer of NHL Cities by Name/City (required csv manipulation)
• Added .dbf of Forbes valuation list
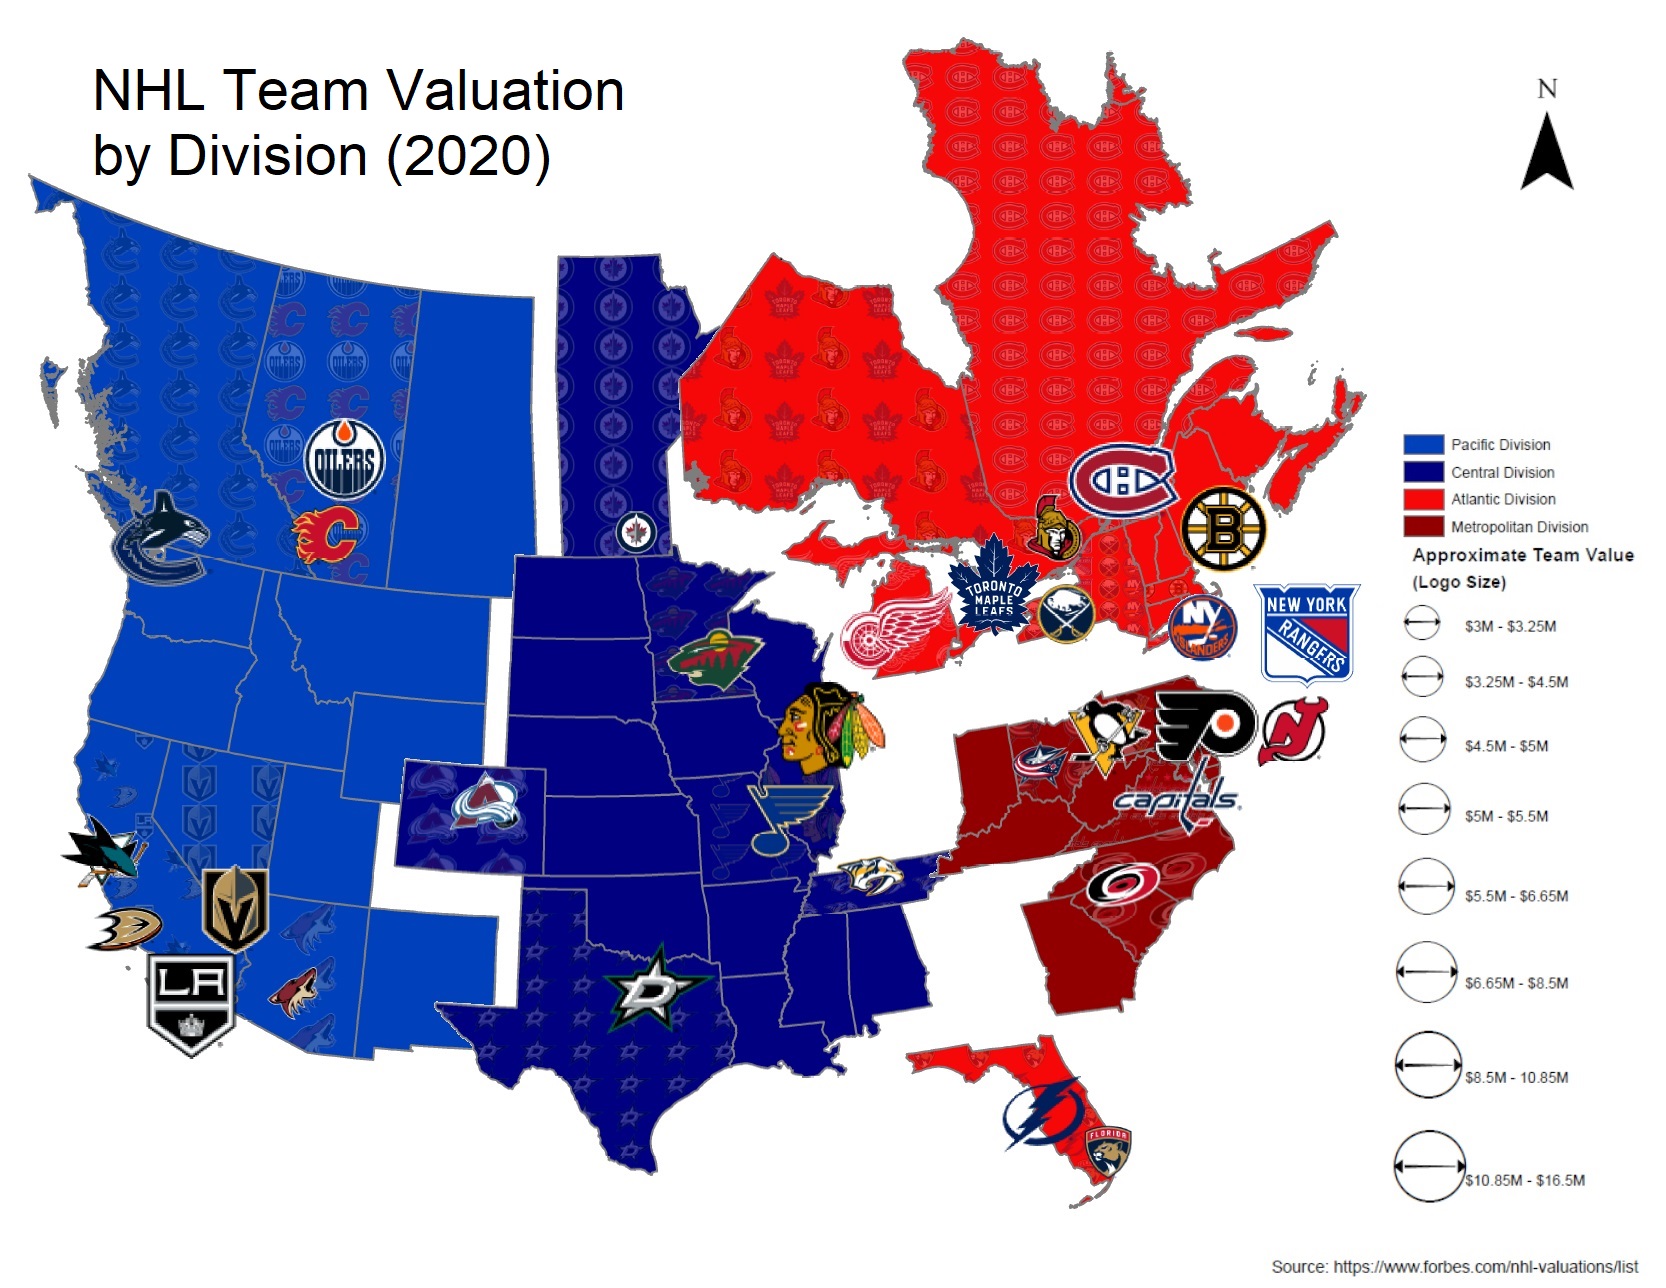
• Created graduated symbols using value into 8 classes
• Changed symbol related to dollar amount within division
• Did this for each division in subsequent dataframes
• Using attribute table, created layer for each division
• Used some clipping to select states and provinces
• Using Attribute table, created layer for each state that has team
• Added all logos for a state as background
• Adjusted separation in the fill properties tab to create a mosaic-like effect
• Used original dataframe to size rings into 8 classes
• Covered entire canvas with four divisions
• Created title, legend, north arrow and added text of source URL
• Exported map to PDF
• Open it with Adobe Acrobat
• Click on the navigation tab "Layers" on the left hand side
• Expand that layer's folder by clicking the plus sign
• Clicking the 'eye' next to "Image" filters which appear and disappear
• Captured snippets of each individually and added them into GIMP
• Removed white with Fuzzy Select Tool
• Ordered layers correctly for “Puzzle-like” effect
• Exported final project as a PNG
-
6 June 2020
-
Professor:
Dr. Jim Thatcher
-
Posted by:
Isaac Van Mechelen